
 Whatsapp
 Telegram
 2026-10-14
 The gold price is expected to continue testing its high level today.
Gold Market Analysis: Gold Price Likely to Test Higher Levels Intraday
October 14, 2026, 11:05 AM
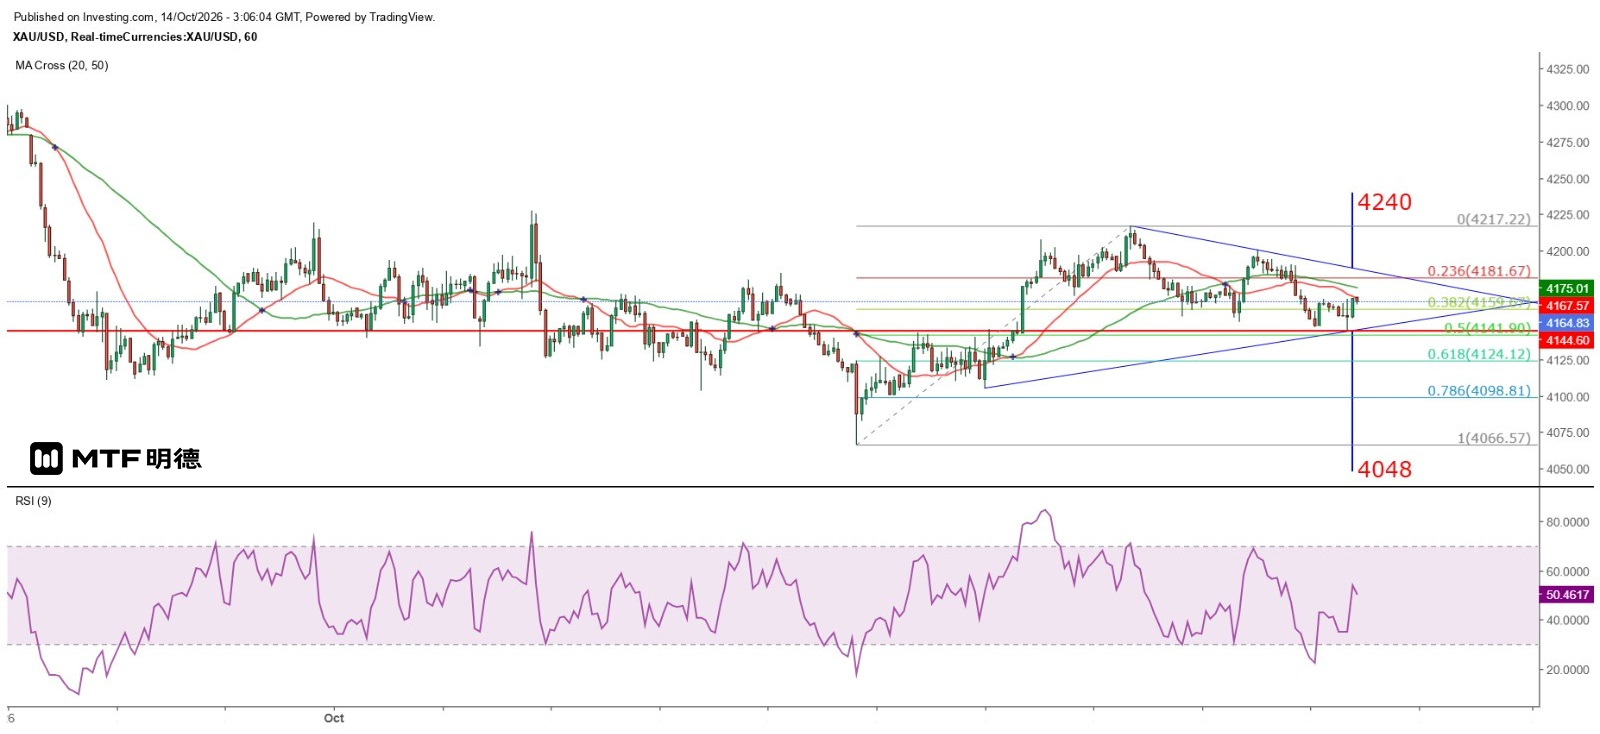
Gold prices have resumed volatile movements. From the 5-minute chart, gold broke above and below its previous highs this morning before rebounding sharply—potentially causing disproportionate losses for short-term traders. On the chart pattern, gold has formed a sideways consolidation zone below approximately $4,166, with wide fluctuations suggesting a possible breakout after clearing resistance. Looking at the daily chart, gold is developing an ascending flag pattern. Provided it holds above or closes higher than $4,130, gold could break upward through the 20-period SMA ($4,214) today or over the next two days, subsequently targeting $4,310.
However, on the hourly chart, gold has recently formed a flat-bottomed descending triangle. Therefore, if it clearly breaks below $4,144, the projected downside target would be around $4,048. Yet, today’s low of $4,144.6 is close to the 50% retracement level of the largest gain since October 7, which stands at $4,141.9. With prices now back above $4,160—above the mid-point of the $4,210–$4,310 range—the likelihood of testing higher levels intraday increases significantly. The immediate upside targets are $4,175 and $4,195.
On the data front, the U.S. will release September CPI figures tonight. The expected year-on-year increase is projected to rise from 3.4% to 3.6%, while core inflation is expected to expand from 2.4% to 2.5%. Unless the rise exceeds expectations, gold should avoid significant declines and may even continue rising. Conversely, if the increase moderates or monthly changes turn negative, that would be highly favorable for gold, making a breakout above $4,310 entirely plausible.
The above information is for reference only and does not constitute investment advice.


