


 Whatsapp
 Telegram
The 50-week moving average of the gold price must not be breached.
"Gold's 50-Week Line Must Not Be Lost" – Completed on 12/6/2026 at 10:56
Yesterday, Trump suddenly announced the cancellation of plans to attack Iran, sending U.S. stocks sharply higher and triggering a significant rebound in gold prices. After touching a low of $4,023.55 during early Asian trading, spot gold recovered. Although it continued to decline after European markets opened, in New York morning session, gold briefly dipped to only $4,053.3, failing to test the $4,010 level. The halt of Iran attack plans by Trump sparked a rapid rise in gold prices, which surged as high as $4,246.38 during early Asian trading today before experiencing a notable pullback, dropping as low as $4,171.57.
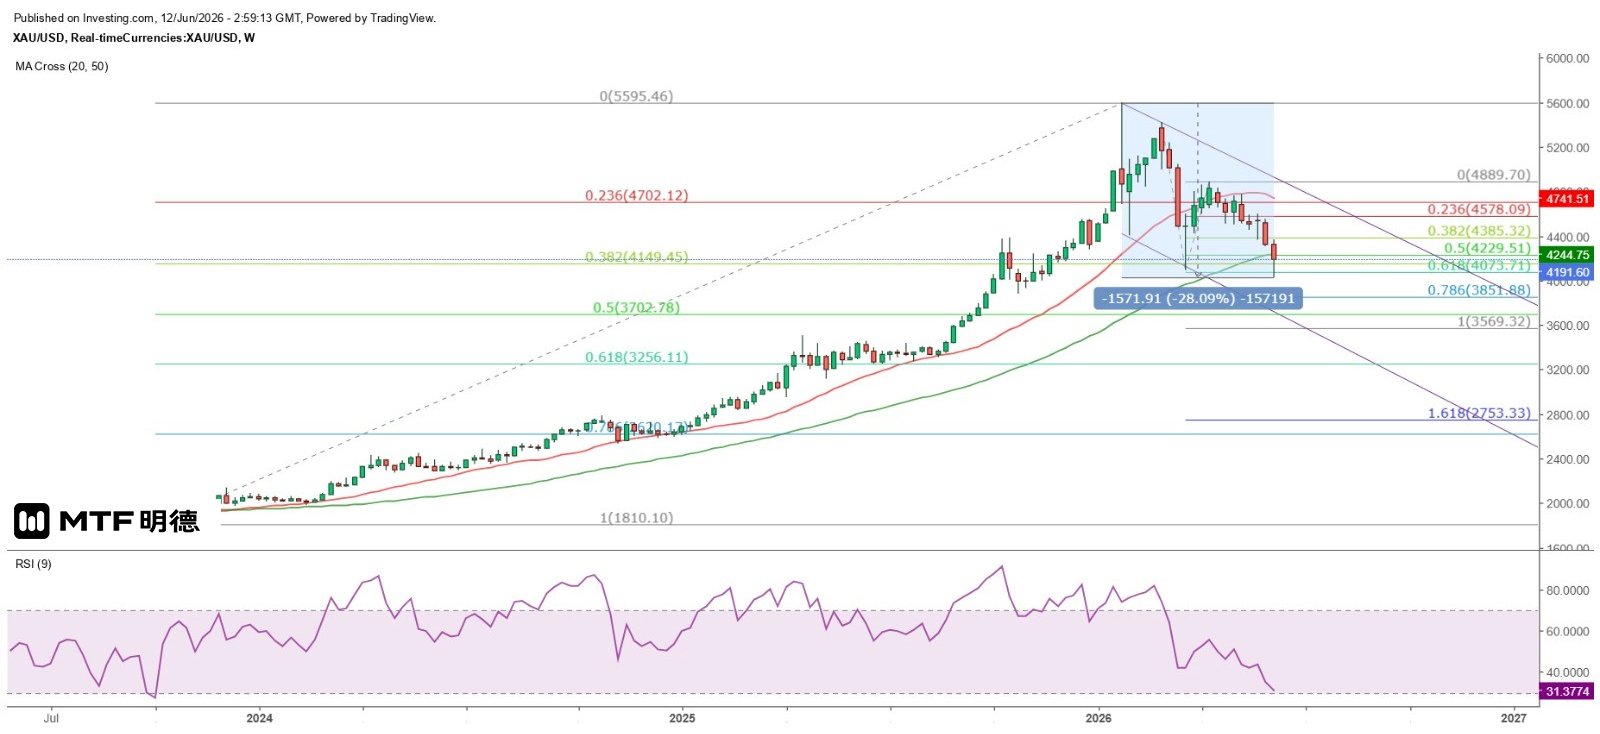
The spot gold price has not tested or fallen below $4,010, indicating strong support at this level where the Gann 90-degree angle lies. The price has also broken above the hourly chart's 50SMA (currently around $4,136.2), while the 20SMA (at $4,136.7) is now rising through the 50SMA. On the daily chart, the RSI dropped to 16.8, suggesting that the current strong upward move is a rebound following severe overselling. However, investors should note that the price has now fallen below the weekly chart's 50SMA (currently around $4,244.6)—the first time since the first week of October 2023—and the recent trend since October 2023 resembles the pattern seen from August 2018 to March 2021.
After peaking at $2,073.4 in August 2020, gold prices declined and broke below the 50-week SMA, hitting a low of $1,676.7 in March 2021—just under $26 above the 100% Fibonacci extension level of $1,650.89, representing a maximum drop of 19.13%. Following a peak of $5,595.46 in January this year, gold has since entered a downward trend, declining by as much as 28.09%, with the lowest point reached this week at $4,023.55. If the price reaches the 100% Fibonacci extension, it could fall to $3,569.32. Currently, gold has already broken below the 50-week SMA, indicating a high risk of falling further below $4,000. The key will be whether gold can reestablish support above the 50-week SMA today or close below it this week. However, if a strong two-week reversal pattern emerges next week and the price regains control above that line, it may prevent further short-term declines.
The above information is for reference only and does not constitute investment advice.
Next Article


