
 Whatsapp
 Telegram
 2026-10-22
At present, the situation with gold suggests short-term selling and long-term buying.
Gold Market Analysis: "Current Gold Situation Favoring Short-Term Buy and Long-Term Sell"
October 22, 2026, 10:40 AM (Completed)
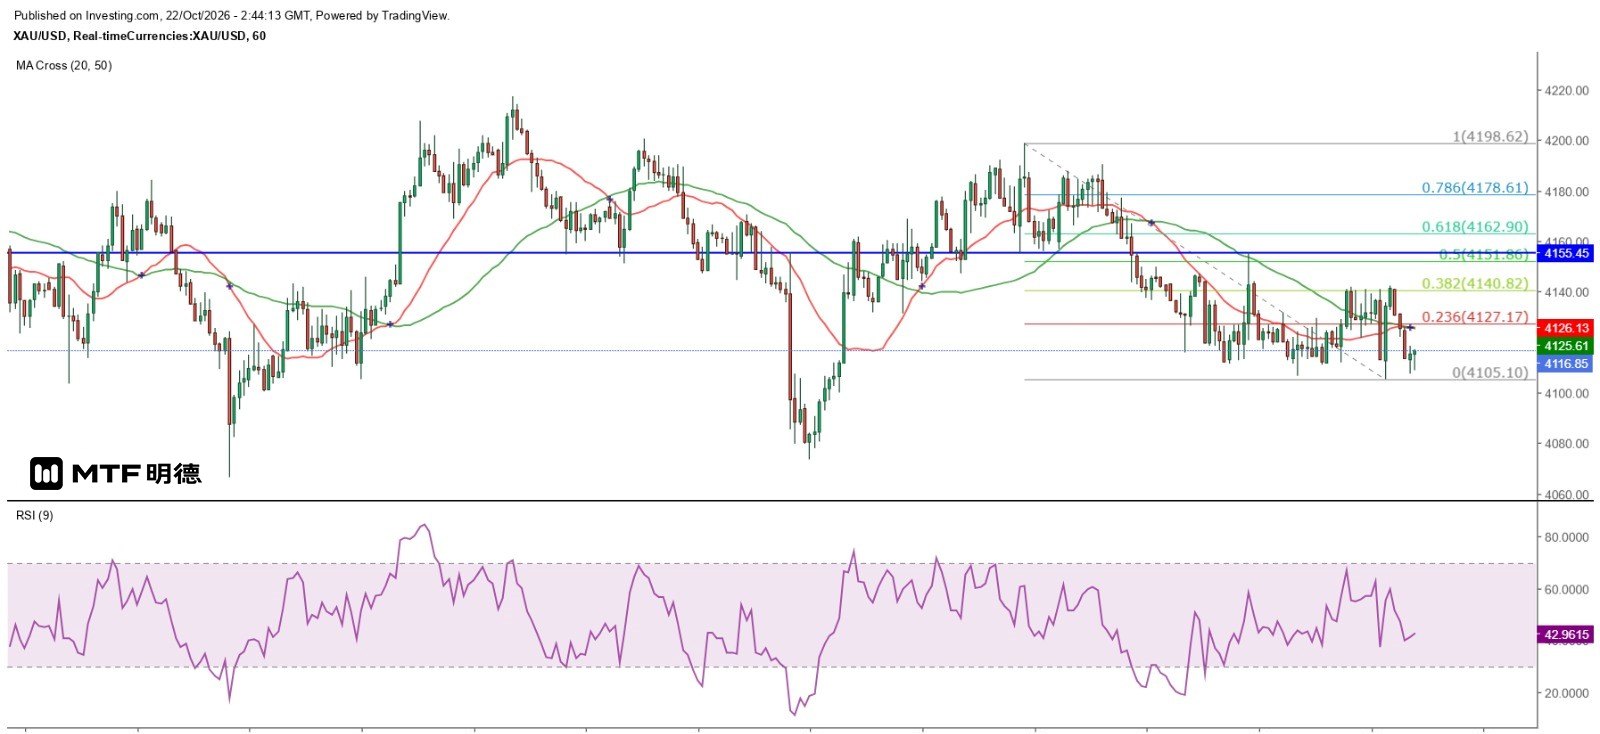
Gold prices have maintained a fluctuating weak trend. From the hourly chart, it is evident that after peaking at $4,190 on Monday this week, gold has declined repeatedly, breaking below $4,110 multiple times. The highest rebound during this period occurred on Tuesday at $4,155.45, which further strengthens my belief that gold is about to break downward. However, investors should remain patient—rather than shorting at the current sideways range's lower boundary, it would be wiser to wait until gold clearly falls below $4,100 before entering a sell position.
Recent fluctuations in gold prices are gradually draining speculative strength. After two or three cycles of upward pushes and downward corrections, not only are low-end buyers and high-end bulls weakened, but their confidence is also eroded. When gold finally breaks out decisively, these speculators may hesitate to follow the trend, missing profitable opportunities. Since gold remains in a sideways pattern, investors should adopt a strategy of selling at higher levels and buying at lower ones. If bearish, focus solely on selling at higher levels, or use relatively larger positions for selling while maintaining smaller positions for buying.
From a short-term cyclical perspective, gold today (based on New York close) touched a bottom and rebounded. However, investors must closely monitor whether this bottom has truly formed, or if prices will continue to make new lows—possibly testing the October 15 low of $4,073.5, or even the entire sideways range’s support level since September 28 at $4,066.5—before recovering. A significant downward breakout could occur if prices fall below the lower boundary of the consolidation zone. Setting aside speculation, recent hourly price action shows a clear downward shift in volatility, with $4,155.45 once again emerging as the key short-term resistance level. The trading range has compressed to approximately $4,100–$4,155. Under these conditions, a strategy of short-term buying and long-term selling appears more aligned with the current market dynamics.
The above information is for reference only and does not constitute investment advice.


