
 Whatsapp
 Telegram
 2026-10-20
Gold prices are experiencing short-term fluctuations while remaining relatively stable in the long term.
Gold Market Analysis: "Short-Term Volatility, Long-Term Bearish Bias"
October 20, 2026, 10:58 AM (Completed)
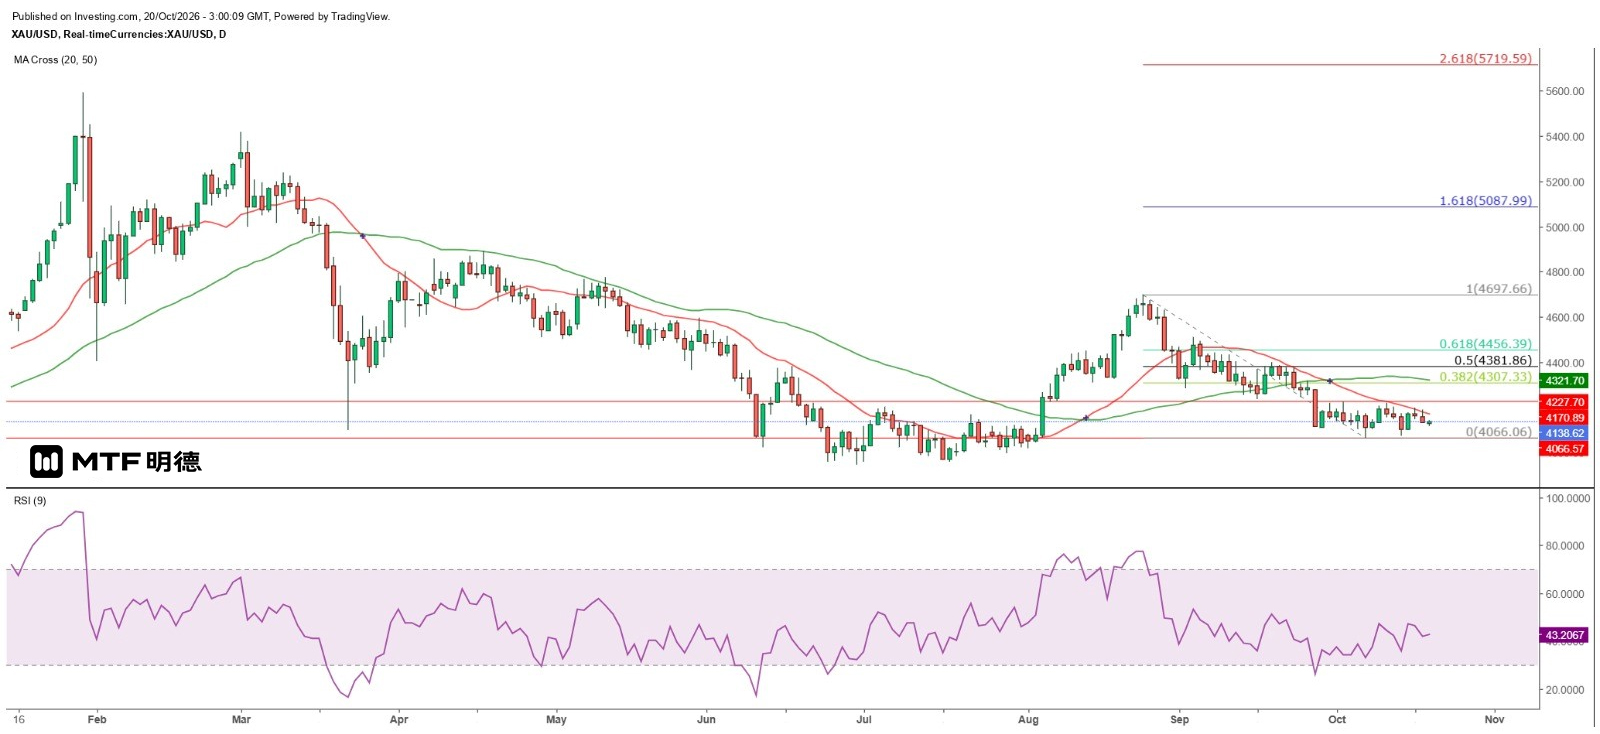
Gold prices remain broadly range-bound between $4,100 and $4,200. On the daily chart, gold has broken above the 20-period SMA ($4,170) in each of the past two trading sessions, and another ascending flag pattern is now forming. Therefore, I still believe there is a high probability that gold will break above the daily 20SMA in the near term. Once this level is breached, it is expected to first target the strong resistance at the Gann square's 180-degree angle at $4,210. A move beyond this level would then aim for the 50SMA at $4,321.
Looking at SPDR’s holdings, after surpassing 1,000 tons in late September 2025, they rose to 1,101 tons by the end of February this year. Since then, although levels have remained above 1,000 tons, recent holdings have fluctuated around 1,050 tons, with minor increases and decreases within a 10-ton range. Historically, SPDR holdings peaked above 1,300 tons in mid-2010, reaching a record high of 1,353.35 tons in early December 2012. However, they subsequently declined steadily, dropping to 638.8 tons by early December 2015 before rising again, peaking at 1,277.65 tons in October 2020. I believe these movements are closely linked to the European debt crisis in 2010 and the European Central Bank’s implementation of quantitative easing in March 2016. Currently, as major global central banks enter tightening cycles, SPDR’s gold holdings are expected to continue declining, with 1,000 tons serving as a key threshold between bullish and bearish sentiment.
Gold prices and SPDR holdings are currently showing divergence. Gold hit a historical high near $5,600 in January this year, yet inventory levels failed to rise in tandem. If holdings fall below 1,000 tons, support may only be found around 900 tons. Meanwhile, $4,000 remains a crucial support level; if breached, the next potential test zone would be $3,000. In October, gold briefly dipped to $4,066—very close to the monthly 20SMA at $4,046—indicating significant upward pressure. A breakdown below this line could signal a medium-term correction, testing the monthly 50SMA at $2,915. In the short term, traders can consider a high-sell-low-buy strategy between $4,110 and $4,210. Should prices rally to $4,380–$4,410, a sell-on-rise approach would be advisable.
The above information is for reference purposes only and does not constitute investment advice.


