
 Whatsapp
 Telegram
 2026-09-24
 The gold price must fall below 4310 in order to reverse the downward trend.
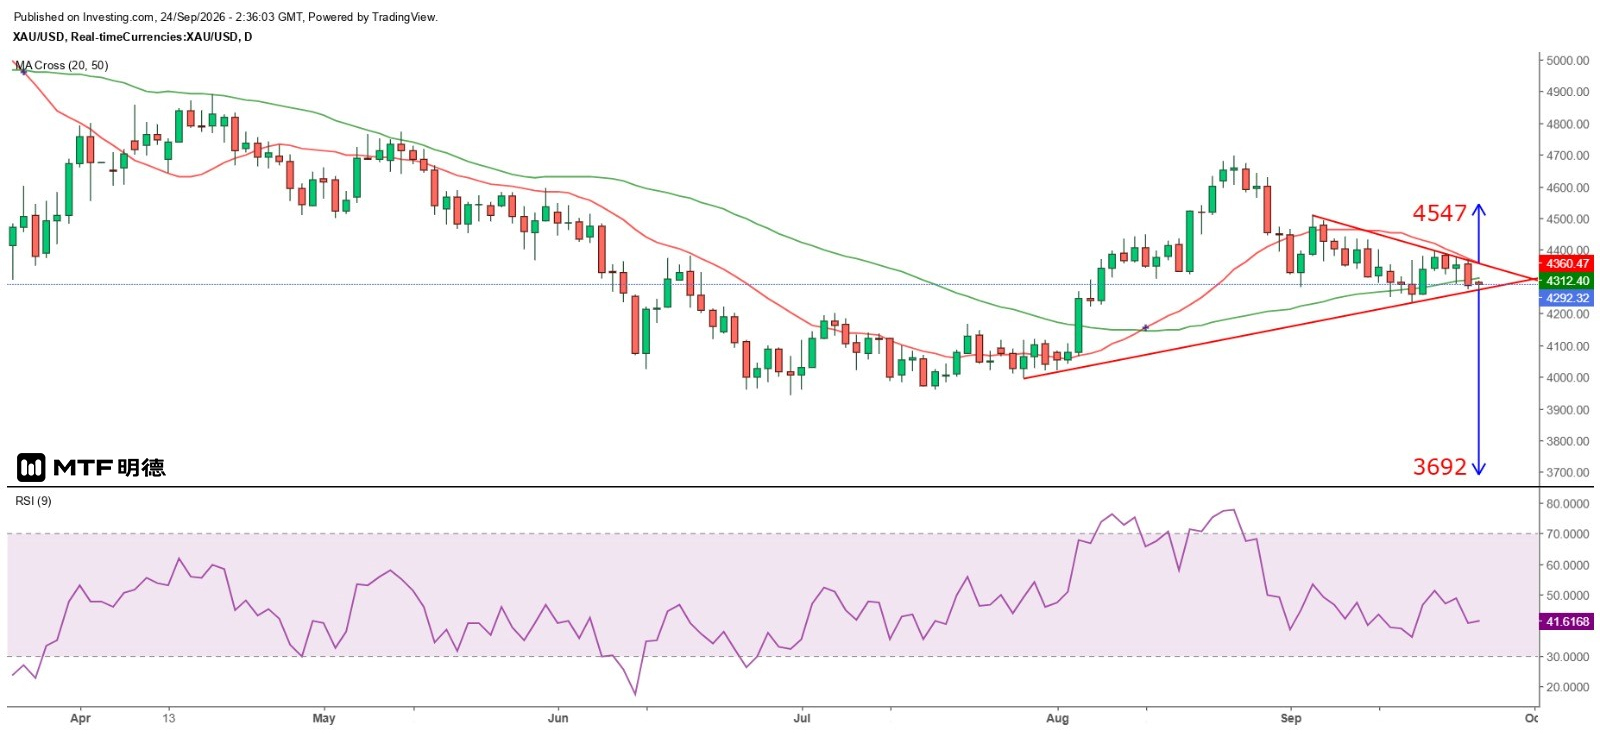
"Gold Price Needs to Break Above 4,310 to Reverse Weakness" – Completed on September 24, 2026, 10:35 AM
U.S. and Chinese leaders met in Washington, where the U.S. Treasury announced an extension of the temporary trade truce by two months, originally set to expire on November 10, giving both sides more time to advance toward a potential trade agreement. Clearly, Trump aims to foster a harmonious atmosphere ahead of the midterm elections through this meeting, suggesting that some form of trade deal is likely to be reached. Meanwhile, regarding the Middle East, the U.S. is expected to avoid escalating military actions against Iran.
Currently, markets anticipate that the leaders' meeting could improve bilateral relations. Resolving trade tensions would help ease import-driven inflation in the U.S., reducing the urgency for Federal Reserve rate hikes and cooling market risk sentiment. This would encourage capital inflows into equities, dampening demand for gold and making significant price gains difficult. Moreover, the Fed has already raised interest rates by 25 basis points in September, officially entering a tightening cycle. Even if further consecutive hikes are unlikely in the near term, with core CPI inflation still above 3%, a rate cut remains out of the question—making the outlook unfavorable for gold prices.
Yesterday, gold prices declined throughout the day. In early Asian trading, it peaked at $4,369.37, then as expected formed a double top on the hourly chart before continuing lower. It hit a low of $4,275.53 during New York midday trading before slowly recovering. This morning, it rose briefly to $4,303.30 but quickly reversed, falling to $4,282.67 before rebounding again. On the five-minute chart, gold is consolidating at lower levels. However, on the hourly chart, it briefly broke above the 20-period SMA (currently around $4,298) this morning, only to reverse sharply with a "head-and-shoulders" breakdown pattern, indicating that $4,310 may have become a key short-term resistance level. Additionally, yesterday’s close saw gold fall below the 50-period SMA (currently around $4,312) on the daily chart. If it breaks below the TD ascending trendline, the projected downside target would be approximately $3,692. To reverse its weak momentum, gold must break above and hold steady above $4,310. Therefore, this level remains the critical resistance for today’s trading.
The above information is for reference purposes only and does not constitute investment advice.


